

State of UK Blogging 2026: 174 Page-One Pages, 24 of Them British
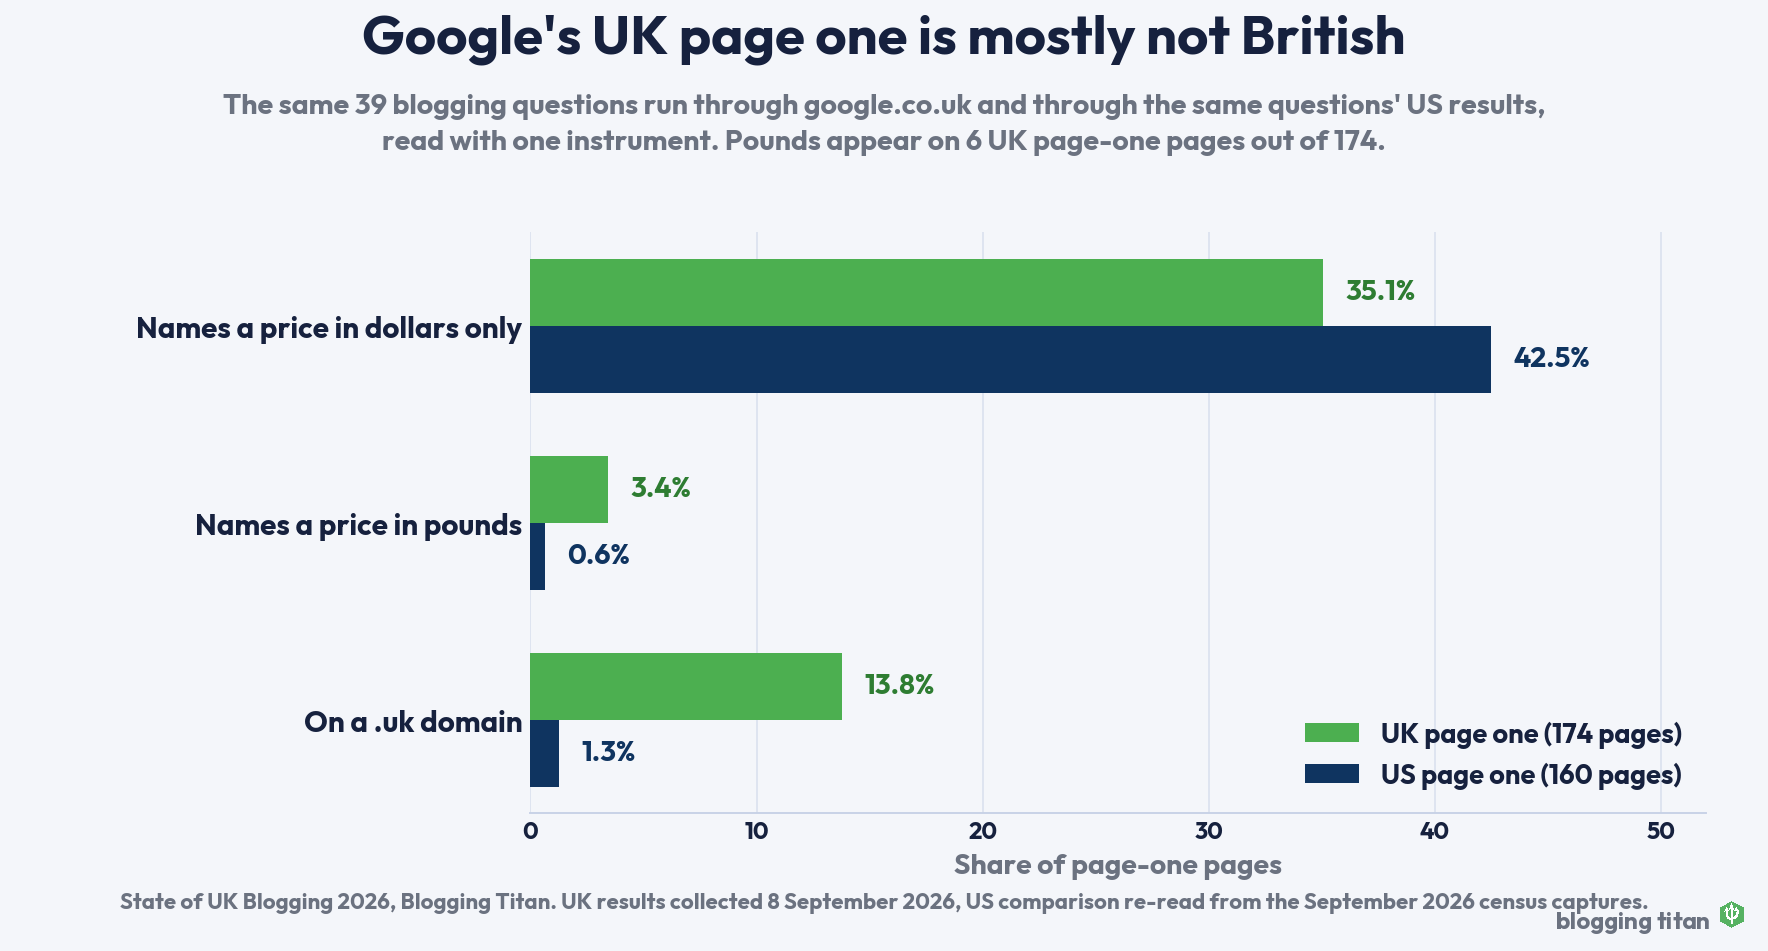
Quick answer: We put 39 blogging questions through google.co.uk from a UK connection and read every page-one result from its Internet Archive capture. After dropping forum threads and pages with no usable capture, 174 pages remained. Twenty-four of them sit on a .uk domain. Six mention a price in pounds. Sixty-one mention a price in dollars and no pounds at all. The UK page one for blogging advice is mostly not British, and its statistics are no better sourced than the American ones: 71.6 percent of the claims on it cite nothing, against 70.5 percent on the US page one measured the same way.
Original study. 174 pages, 133 sites, 39 questions, google.co.uk with personalisation off, read 8 September 2026. Edition one of an annual series.
Cite this study
Blogging Titan (2026). State of UK Blogging 2026. Published 8 September 2026. https://bloggingtitan.com/case-studies/state-of-uk-blogging-2026/
The numbers, up front
- 24 of 174 page-one pages (13.8 percent) are on a .uk domain. On the same 39 questions in the United States the figure was 2 of 160.
- 13 of the 39 questions return no UK domain anywhere on page one.
- 93 of the 235 URLs we collected from UK page one are the same URLs that rank on page one in the United States. Same pages, different country.
- Sixty-seven pages name a price in some currency. Sixty-one of them use dollars only. Five use pounds only. One uses both.
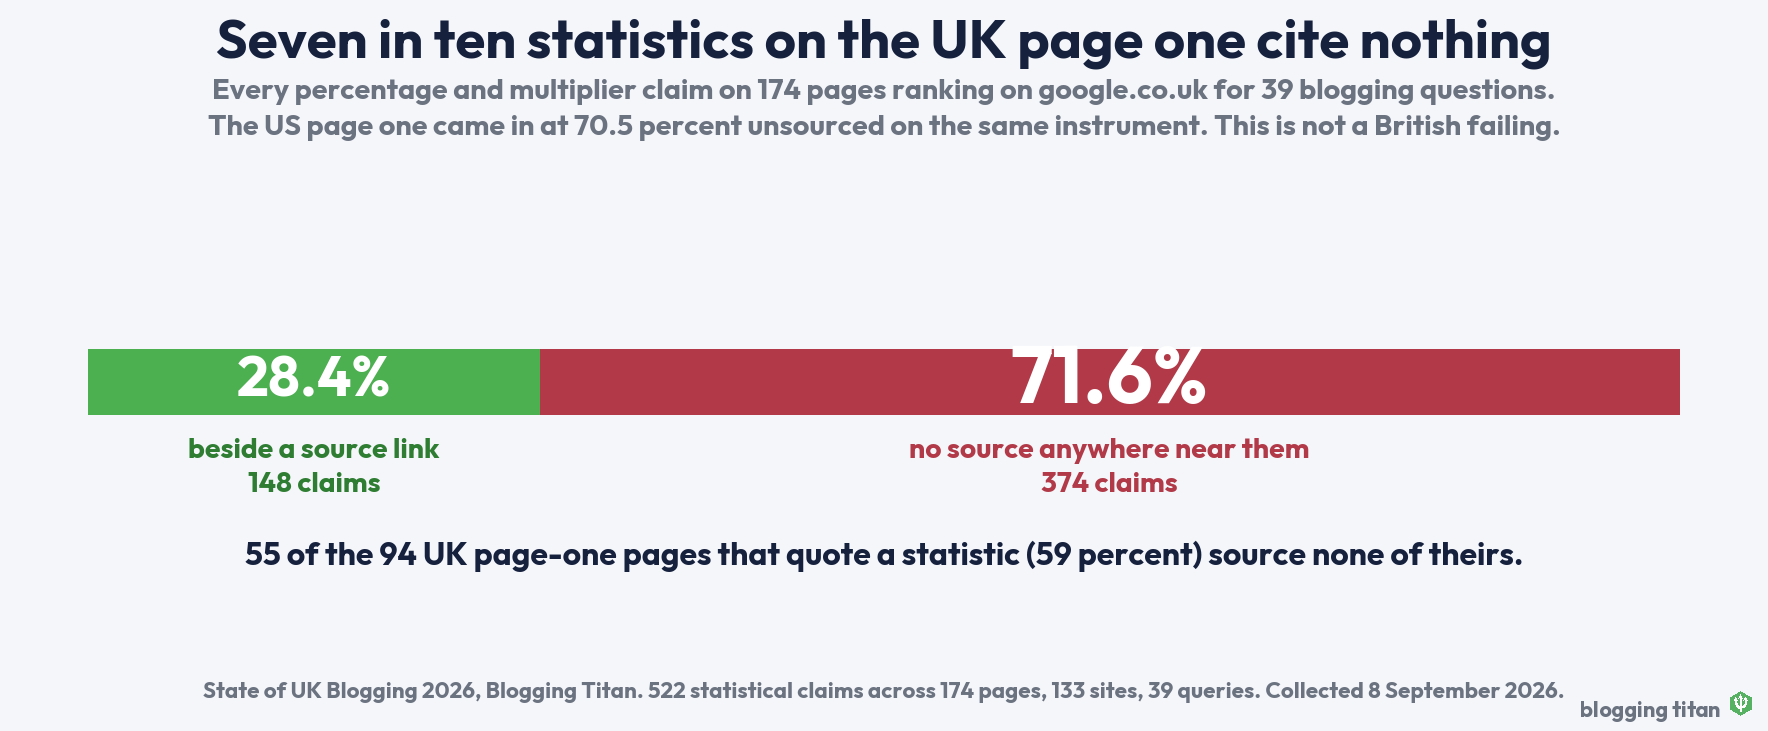
- 71.6 percent of statistical claims cite nothing (374 of 522). The US page one scored 70.5 percent on the same instrument, so this is not a British failing.
- 55 of the 94 pages that quote a statistic source none of them. Median source density on a page that quotes statistics is zero.
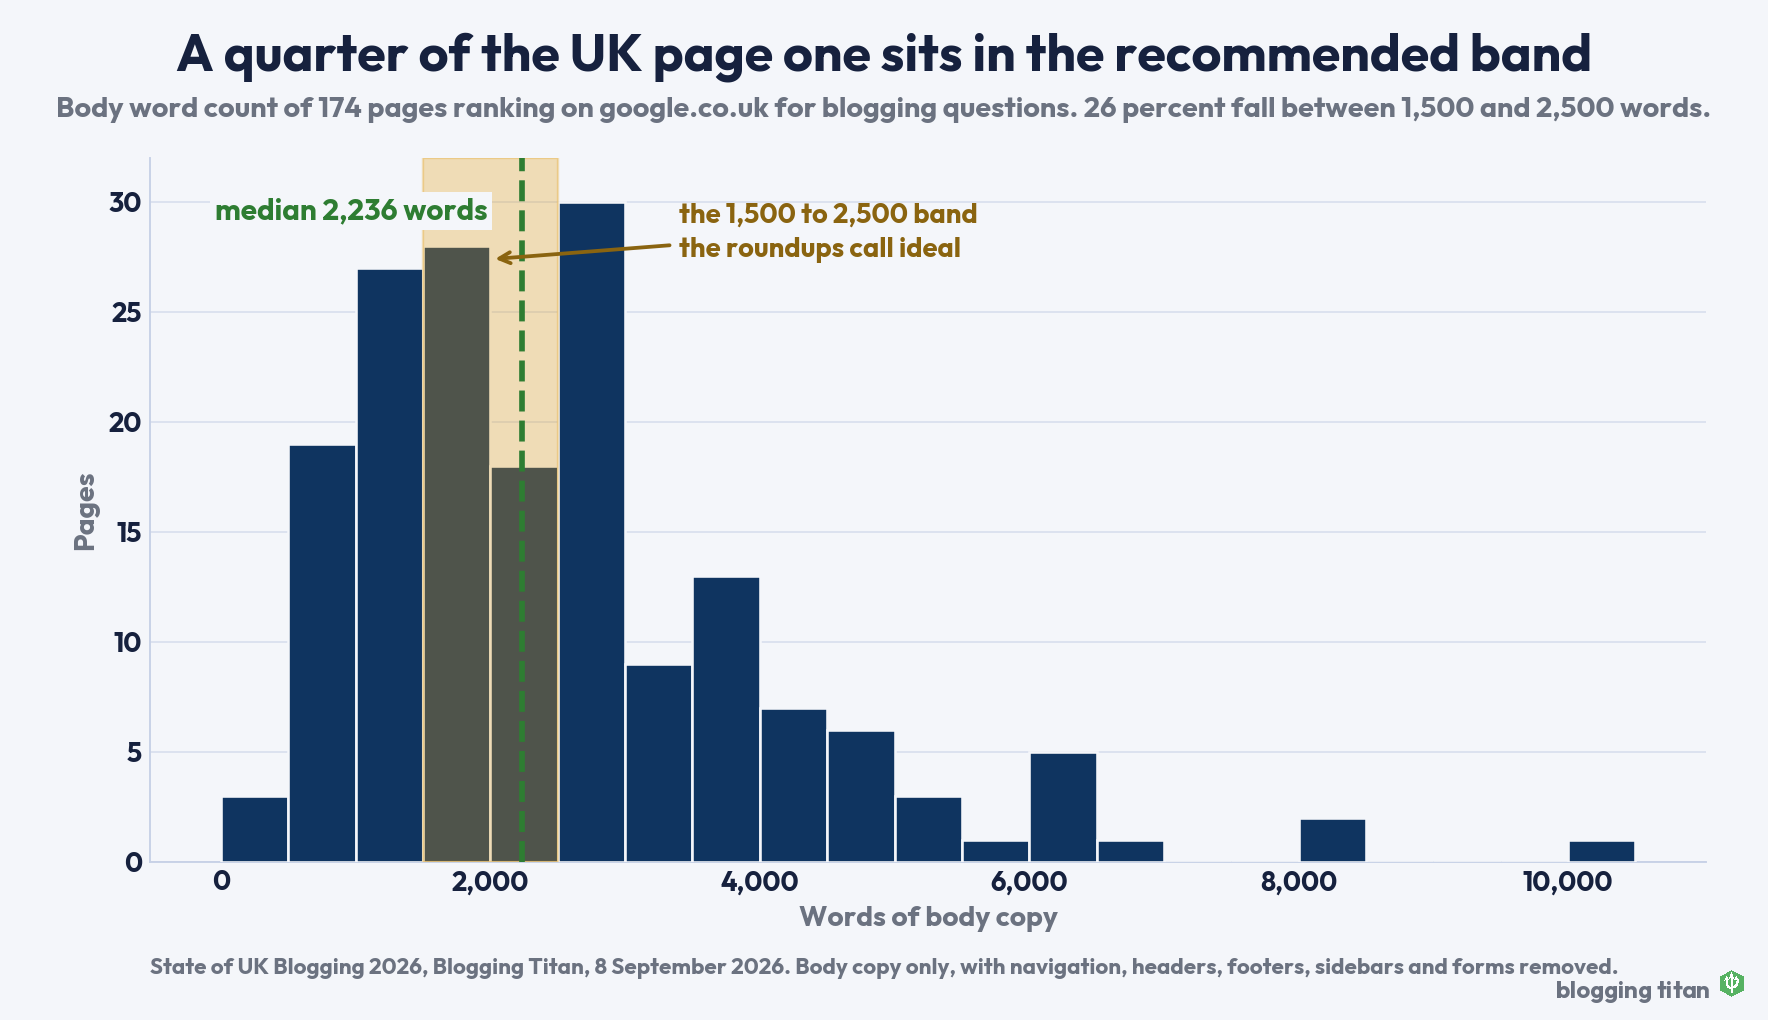
- The median page runs 2,236 words. Only 26 percent sit in the 1,500 to 2,500 band the roundups call ideal.
- WordPress runs 55.2 percent of UK page-one blogging content. HubSpot CMS is second on 15.5 percent.
- Thirty-five pages carry affiliate links. Eight carry no disclosure wording at all, and nine use the “may earn a commission” phrasing the ASA has already ruled ambiguous.
- 28.2 percent publish no date of any kind.
What we did, and what we will keep doing
Every year this study runs the same 39 questions, through the same search settings, measured with the same instrument. That is the whole point of it. A one-off snapshot tells you what page one looked like on a Tuesday. A fixed instrument run every September tells you what changed, and change is the thing nobody in this subject can currently show you.
The questions cover starting a blog, traffic, SEO, monetisation, email, tools, AI writing, design, comments and backlinks. They are the same 39 that produced our page-one blogging census a week ago, which used United States results. Nothing was reworded for a British audience, deliberately. The variable under test is the search engine, not the question.
Searches ran on google.co.uk from a UK connection with personalisation off, on 8 September 2026. That returned 317 organic results. We dropped 75 of them as platform threads and listings rather than articles: Reddit, Quora, YouTube, LinkedIn, Medium and the rest. Deduplicating what was left gave 235 unique URLs.
Each page was then read from its most recent Internet Archive capture rather than live. That costs a little freshness and buys two things worth more: every measurement points at a permanent URL anyone can open, and next September’s run can be checked against captures that still exist. Thirty-four URLs had no usable capture. Twenty-seven returned under 200 words of body copy, which is an extraction failure rather than a thin page, so they came out. The study is the remaining 174 pages across 133 sites. Median capture age was 116 days, and 12 pages had nothing captured in the last year.
The full dataset is published: every URL, its capture link and all 25 measurements behind the figures below, 174 rows of CSV. The method page holds the frozen instrument and the calibration run against last week’s US corpus.
Page one in Britain is mostly not British
Twenty-four of the 174 pages sit on a .uk domain. Three of those are universities. Two are the same domain registrar. The rest are a scattering of small agencies and personal blogs: a copywriter, a coffee blog, a plant-based food site, a north-west property news title.
Thirteen of the 39 questions return no UK domain at all. They are not obscure questions. “Blog post ideas”, “blog niche ideas”, “keyword research for bloggers”, “how to monetize a blog”, “newsletter vs blog”, “wordpress vs wix”, “blog design best practices”, “blogging income report”. A British blogger asking Google any of those gets an all-foreign page one.
The overlap is the part that surprised us. Of the 235 URLs UK page one returned, 93 are the exact same URLs that rank on page one in the United States, and 71 of the 181 UK hosts also appear in the US corpus. Google is not building a British answer and stocking it with British publishers. It is largely showing the American answer with a few local pages folded in. We are calling that the imported page one: a national result set that is mostly published elsewhere, priced elsewhere, and written for somewhere else.
For anyone building a UK site this cuts both ways. The competition on these questions is not the agency down the road, it is Wix, Semrush and Mailchimp, who between them hold 20 of the 174 slots. But the gap is real and it is measurable, and the next section is where it is widest.
The answer comes priced in dollars
Sixty-seven of the 174 pages name a price in some currency. Sixty-one use dollars and never mention pounds. Five use pounds only. One uses both. So a British reader who searches on google.co.uk, gets a page that quotes a price, and wants that price in their own money, is served six times out of 67.
This is not a rounding error in a reader’s head. Hosting, email tools and SEO software are the three things blogging advice tells people to buy, and every one of them prices differently in sterling, often with VAT handled differently again. A page that says a plan costs 12 dollars a month is not answering the question a UK reader asked. Our own tool pricing pages exist because of that gap, and this is the first time we have had a number for how wide it is.
Seven in ten statistics still cite nothing
We counted every percentage and every multiplier claim of the “three times more traffic” kind, block by block. A claim counts as sourced if a link to another site sits in the same paragraph, list item or table cell. The test is deliberately generous. A link to an affiliate programme counts. So the sourced share is a ceiling and the unsourced share is a floor.
Across the UK corpus there were 522 claims. 148 sat beside a source. 374 did not. That is 71.6 percent unsourced, against 70.5 percent when we read the US corpus with the same instrument. Whatever is wrong with sourcing in this subject, it is not a national habit and Britain has not escaped it.
Fifty-five of the 94 pages that quote a statistic source none of theirs. Thirteen pages carry ten or more claims and six of those cite nobody. An Adobe page on posting frequency carries 28 claims and links to nobody. An Attentive page on email lists carries 13 and links to nobody. The largest single page, an affiliate marketing guide carrying 65 claims, sources 18 of them.
The habit is not universal, which is the useful part. The American Marketing Association’s explainer on content marketing sources all 18 of its claims. An NYT Licensing piece on blog engagement sources all 10 of its own. Every link in this paragraph points at the capture we measured, so the counting is yours to repeat.
The length advice does not describe the UK page one either
The median UK page-one page runs 2,236 words. A quarter run under 1,428 and a quarter run over 3,319. The shortest is 349 words and the longest is 10,811, and both rank. Only 26 percent land in the 1,500 to 2,500 band that blogging advice, ours included until recently, calls the sweet spot. That band describes about one page in four.
Position inside the top ten told us nothing useful about length, and we would not expect it to on a sample this size. The reading worth having is the spread. There is no length that page one agrees on, in either country.
What the UK page one runs on
WordPress powers 55.2 percent of these pages. HubSpot’s CMS is second on 15.5 percent, which is a fair reflection of how much of this subject is written by companies selling marketing software. Squarespace takes 7.5 percent, Next.js and other custom builds 4.6 percent, Wix 4.0 percent, Blogger 2.3 percent, and Drupal and Webflow 0.6 percent each. We could not fingerprint 9.8 percent.
The WordPress figure people usually quote answers a different question. W3Techs measures WordPress across every site on the web, parked domains and brochure sites included. This number is narrower and more useful: it is the share of pages that actually rank for questions about blogging. It was 51.3 percent on the US page one. Both figures say the same thing to anyone choosing a platform this year.
Money, and the labels the CAP Code asks for
Forty-two percent of these pages carry a revenue mechanism we could detect: affiliate links on 20.1 percent, an own product or service on 20.7 percent, display advertising on 14.9 percent. Email capture, which is a revenue mechanism with a delay, appears on 54.6 percent. A third of the corpus, 33.9 percent, carries nothing at all, not even a form.
Detection undercounts, so treat those as floors. Cloaked affiliate links and server-side ad insertion do not leave the fingerprints we look for.
The disclosure numbers are where the UK question gets sharper, because British publishers are covered by the CAP Code and the ASA has already ruled on this. Of the 35 pages carrying affiliate links, eight carry no disclosure wording anywhere in the body. Of the 27 that do, six put it past the halfway point of the page. Nine use the “may earn a commission” family of phrases.
That last group matters more than it looks. In its advice on online affiliate marketing, CAP notes that the ASA considered the phrase “may earn an affiliate commission” ambiguous and confusing in a ruling against MailOnline, because it implies the publisher might not be paid when it will be. The same advice says a disclaimer at the bottom of a post is unlikely to be sufficient. Our instrument counts any of those phrasings as a disclosure, which means our own count of 27 is more generous than the Code is.
Only seven pages in the whole corpus use rel=”sponsored” on any link, against 35 with affiliate link patterns.
Dates, or the lack of them
Seventy-two percent publish a date. Sixty-six percent publish a modified date. 28.2 percent publish neither, which is almost exactly the US figure of 29.4 percent. Across the whole corpus, 21.8 percent carry a date in 2026 and 13.8 percent carry nothing newer than 2022.
Undated advice about a subject where prices, tools and search behaviour change every quarter is a problem for readers and, on the evidence of our other work, no obstacle at all to ranking.
What this study does not measure
- It does not check whether a statistic is true. Source density counts proximity to a link, not accuracy. A page can cite a source that says something else entirely and score well.
- It penalises original research. A page reporting its own data has nothing to link to. This one would score badly on its own instrument.
- Archive captures are not live pages. Median capture age was 116 days and 12 pages had no capture inside a year, so a handful of measurements describe an older version of the page.
- Detection undercounts money and video. Anything rendered by JavaScript after capture is invisible to us.
- One country, one day, 39 questions. This is the blogging-advice corner of the UK index, not the UK web.
- Blogging Titan ranks on page one for none of the 39 questions. That was true in the US census and it is true here. We are measuring a room we are not yet in.
Why this repeats every September
Everything above is a snapshot, and a snapshot of a search result is worth very little on its own. What is worth something is the same 39 questions, the same settings and the same definitions run again in September 2027, and again after that, so that the .uk share, the dollar share, the sourcing rate and the platform mix become a line rather than a dot.
To make that possible the instrument is frozen and published. The method and editions page holds the question list, the exclusion rules, every measurement definition, and the calibration run we did against last week’s US corpus so that the two waves can be compared honestly. Where a definition has to change, the version number changes with it and the change is recorded there.
Next edition: September 2027. If you want to check any figure on this page before then, the dataset has a row and an archive link for every page we read.
Related original research from Blogging Titan: the page-one blogging census that this study extends, the AI citation league table covering 100 questions across ChatGPT and Perplexity, and our blogging statistics roundup, which now leads with figures we measured ourselves.

Written by
Blogging Titan Team
Blogging Titan is an independent team of bloggers documenting what actually grows a blog in the AI search era. We have been building, ranking, and monetizing WordPress sites since 2017, and every guide on this site is based on strategies and tools we have tested ourselves. Want a second pair of eyes on your blog? Request a free blog audit or start with the 2026 playbook.